
Mortgage lenders sold these loans to a bank or government-chartered institutions created to buy up mortgages and provide mortgage lenders with more money to lend. This meant that the loans were getting chopped up and sold, split apart until they were widely distributed across many different banks. As long as housing prices kept rising, everyone profited. Mortgage holders with inadequate sources of regular income could borrow against their rising home equity. When the housing bubble burst, more and more mortgage holders defaulted on their loans. At the end of September, 7% of homeowners with a mortgage were at least one month past due on their payments, up from 5.6% form the previous year. By 2008, the mild slump in housing prices that had begun in 2006 had become a free fall in some places.


3 comments:
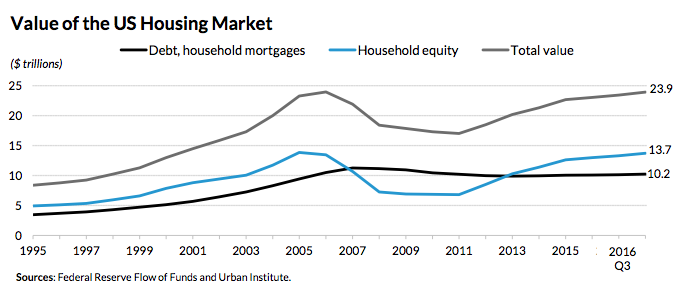
Great summary of the housing market and extreme loaning for down payments and mortgaging by banks. The housing market was a large factor weighing into the recession and seeing how it all unfolded after the fact is quite fascinating.
It's crazy to think how something so dangerous and risky happened so recently in our history, good use of graphs to provide context to the information.
It was very interesting reading about the crisis in more depth, I vaguely remember being aware of it while it was happening, but of course I wasn't able to understand the scope or the details of how the crisis ensued. Your graphs and detailed descriptions were very informative.
Post a Comment